Setup for Raspberry Pi Pico 2 W and Segger J-Link Edu Revisited
Wednesday, 29 January 2025
Another project involving a Raspberry Pi Pico 2 has led me back to this article from last year about setting up a Segger J-Link "EDU Mini" debugger. The instructions were useful to some other people, and I needed to look at them again myself in order to remember how to set it up. The instructions from Segger describe only how to connect the full-size J-Link debugger, which has a completely different pinout.
Pico debugging is via a Serial Wire Debug (SWD) connection, which is a two-wire bus (clock and data). This can be connected to a hardware debugger, and I am using the EDU Mini J-Link debugger, though other options are available - see the Pico Getting Started guide (appendix A).
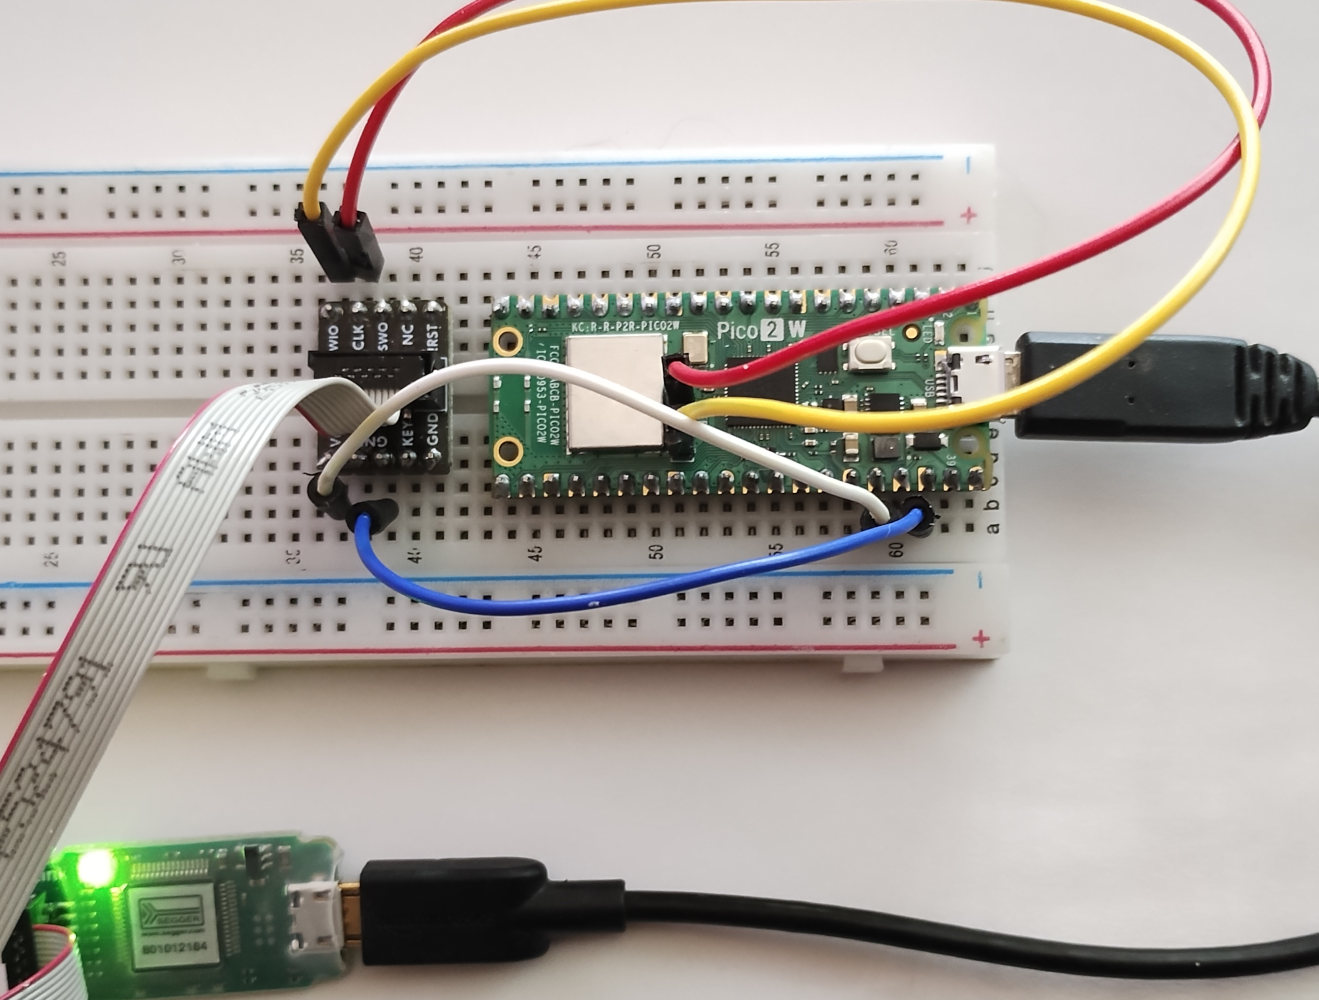
The "H" series of Pico devices have a debug socket for a 3-pin JST-SH cable, which you can buy from various places e.g. Pi Hut, while other Pico and Pico 2 devices just have 3 holes labelled "Debug" and you need to solder your own pins. The connections are the same in either case - the pins are SWCLK, GND and SWDIO.
If you have a J-Link "EDU Mini" debugger, you really ought to get a breakout board (also here) which plugs into a standard 0.1" breadboard, because you can't reliably attach anything directly to the J-Link debugger's pins or to the ribbon cable (I tried this and the results were poor).
Here's what you need to know in order to connect the breakout board, J-Link debugger and the Pico board. It's the same for both Pico and Pico 2:
| Pico debug pin | Breakout board pin | J-Link Edu pin | JST-SH Debug cable wire colour |
|---|---|---|---|
| SWCLK | CLK | 4 | red |
| GND | GND | 5 | black |
| SWDIO | SWIO | 2 | yellow |
| 3V3 - pad 36 | Vref | 1 | none |
If your Pico doesn't have the JST-SH header, the pins are labelled on the underside of the board.
These pictures show the connections needed. Here is a picture of debug connections for a Pico 2 W without a JST-SH debug socket:
Here is a picture of a Pico WH with a JST-SH debug socket and a debug cable:
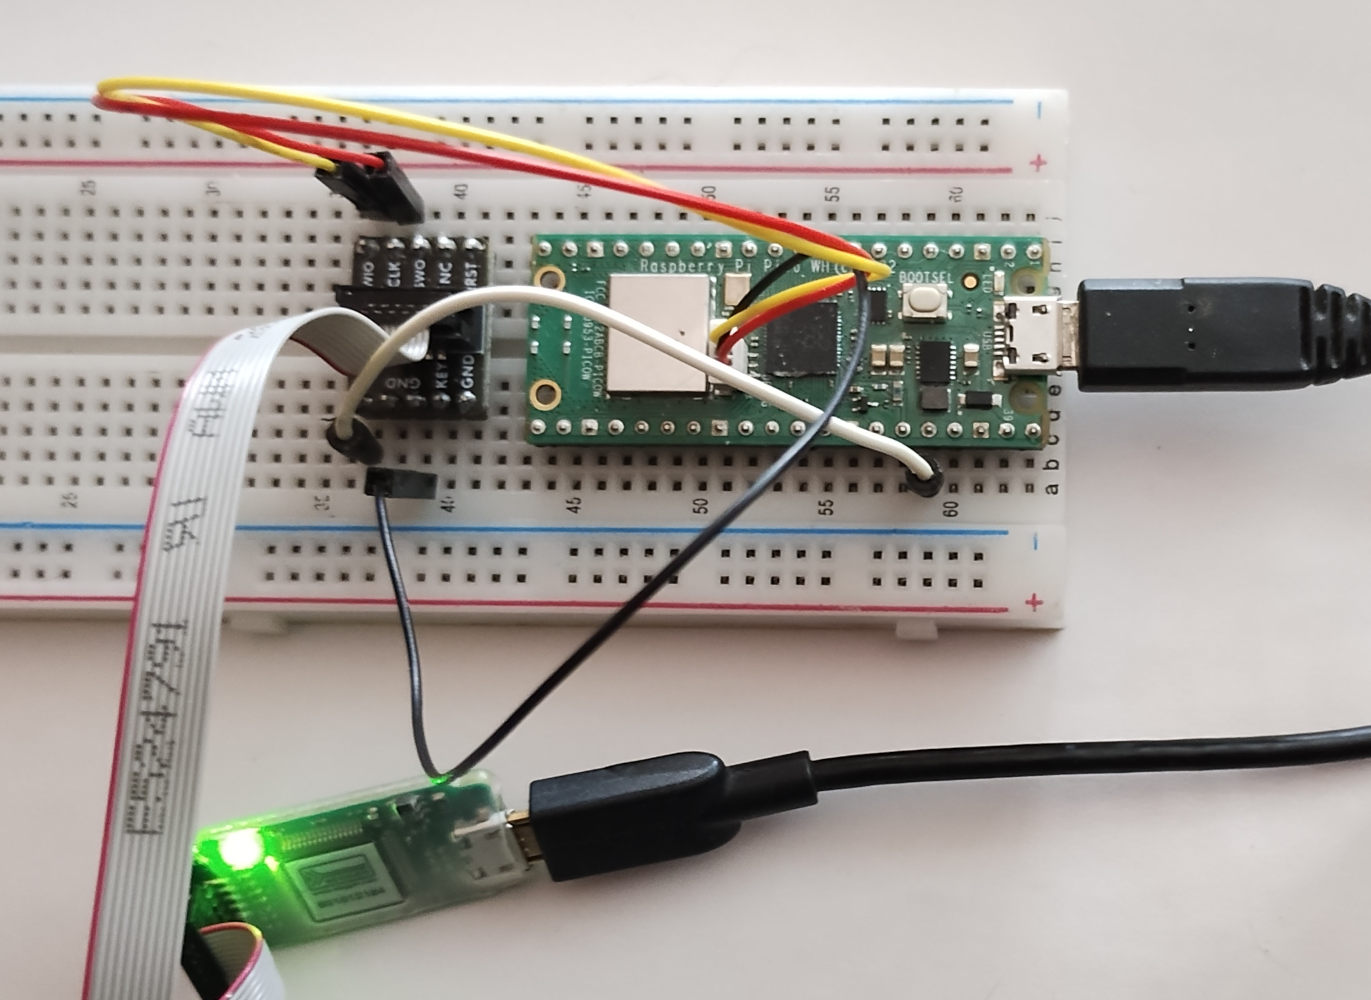
It is potentially confusing that the breakout board has an "SWO" pin and two other "GND" pins - leave these unconnected. The red wire on the ribbon cable should line up with Vref (pin 1) at both ends.
Once you have made the physical connections you can install the Segger J-Link software. There are Windows and Mac versions, but I do all of my Pico development on Linux, so my instructions are for Linux, though I think they will work on Windows too. I installed the 64-bit DEB package: files appear in /opt/SEGGER.
"JLinkGDBServer" acts a bridge between GDB and the hardware. There is a GUI for this tool, but I don't recommend it, because if your settings or physical connections are incorrect, the GUI will close automatically without giving you an opportunity to try again. For usability, the command line wins here. For Pico 2, use this command:
    /opt/SEGGER/JLink/JLinkGDBServer select USB -device RP2350_M33_0 \
        -endian little -if SWD -speed 4000 -noir -LocalhostOnly \
        -nologtofile -port 2331 -SWOPort 2332 -TelnetPort 2333
For Pico 1:
    /opt/SEGGER/JLink/JLinkGDBServer select USB -device RP2040_M0_0 \
        -endian little -if SWD -speed 4000 -noir -LocalhostOnly \
        -nologtofile -port 2331 -SWOPort 2332 -TelnetPort 2333
This command will print some helpful messages about the process, and here's an example of what you can expect to see:
    SEGGER J-Link GDB Server V8.12d Command Line Version

    JLinkARM.dll V8.12d (DLL compiled Jan 29 2025 13:09:42)

    Command line: -device RP2040_M0_0 -endian little -if SWD -speed 4000 -noir -LocalhostOnly -nologtofile -port 2331 -SWOPort 2332 -TelnetPort 2333
    -----GDB Server start settings-----
    GDBInit file:                  none
    GDB Server Listening port:     2331
    SWO raw output listening port: 2332
    Terminal I/O port:             2333
    Accept remote connection:      localhost only
    Generate logfile:              off
    Verify download:               off
    Init regs on start:            off
    Silent mode:                   off
    Single run mode:               off
    Target connection timeout:     0 ms
    ------J-Link related settings------
    J-Link Host interface:         USB
    J-Link script:                 none
    J-Link settings file:          none
    ------Target related settings------
    Target device:                 RP2040_M0_0
    Target device parameters:      none
    Target interface:              SWD
    Target interface speed:        4000kHz
    Target endian:                 little

    Connecting to J-Link...
    J-Link is connected.
    Firmware: J-Link EDU Mini V1 compiled Dec  4 2024 17:56:44
    Hardware: V1.00
    S/N: 801012184
    Feature(s): FlashBP, GDB
    Checking target voltage...
    Target voltage: 3.30 V
    Listening on TCP/IP port 2331
    Connecting to target...
    Halting core...
    Connected to target
    Waiting for GDB connection...
If any wire is disconnected you will see an error and the program will exit immediately. For example, if SWDIO or SWCLK is disconnected:
    Connecting to target...
    ERROR: Could not connect to target.
    Target connection failed. GDBServer will be closed...Restoring target state and closing J-Link connection...
    Shutting down...
    Could not connect to target.
    Please check power, connection and settings.
If you don't connect the Vref line, the connection might appear to work, but won't be stable:
    Connecting to target...
    Connected to target
    Waiting for GDB connection...
    WARNING: Target connection lost. Resetting server.
Once you are connected, and the program is waiting for the GDB connection, leave it running. You will need to restart JLinkGDBServer manually if the Pico becomes disconnected (use control-C to stop it).
Hints for GDB:
- You should use the "gdb-multiarch" variant of GDB as this has support for the Thumb instruction set used by the Cortex-M CPU. Install this on your Linux system in the usual way (e.g. "apt install gdb-multiarch").
- If possible, rebuild your Pico firmware with the CMake option "-DCMAKE_BUILD_TYPE=Debug".
- Run GDB with one parameter: the path to the .elf file for your Pico firmware as this contains debug symbols and references to your source code. This can usually be found in the "build" directory.
- When GDB starts up, enter "target remote ::1:2331" to connect ("::1" is IPv6 shorthand for localhost, and quicker than typing out "localhost" or "127.0.0.1").
- If the program crashes to the extent that GDB is not usable any more, quit from both GDB and JLinkGDBServer, and then power-cycle the Pico by unplugging and replugging it before restarting the software. JLinkGDBServer doesn't seem to be able to connect to the Pico if it is in certain lock-up states.
Here is an example GDB session for the pico-examples program blink:
    ~/Projects/rpi-pico/pico-examples/build/blink$ make
    [  0%] Built target cyw43_driver_picow_cyw43_bus_pio_spi_pio_h
    [  0%] Built target bs2_default
    ...
    [100%] Linking CXX executable blink.elf
    [100%] Built target blink
    ~/Projects/rpi-pico/pico-examples/build/blink$ cp blink.uf2 /media/jack/RPI-RP2/
    ~/Projects/rpi-pico/pico-examples/build/blink$ gdb-multiarch blink.elf
    GNU gdb (Debian 13.1-3) 13.1
    Copyright (C) 2023 Free Software Foundation, Inc.
    License GPLv3+: GNU GPL version 3 or later <http://gnu.org/licenses/gpl.html>
    ...
    Type "apropos word" to search for commands related to "word"...
    Reading symbols from blink.elf...
    (gdb) target remote ::1:2331
    Remote debugging using ::1:2331
    timer_time_reached (t=<optimized out>, timer=0x40054000)
        at /home/jack/Projects/rpi-pico/pico-sdk/src/rp2_common/hardware_timer/include/hardware/timer.h:323
    323	    uint32_t hi = timer->timerawh;
    (gdb) bt
    #0  timer_time_reached (t=<optimized out>, timer=0x40054000)
        at /home/jack/Projects/rpi-pico/pico-sdk/src/rp2_common/hardware_timer/include/hardware/timer.h:323
    #1  time_reached (t=<optimized out>)
        at /home/jack/Projects/rpi-pico/pico-sdk/src/rp2_common/hardware_timer/include/hardware/timer.h:335
    #2  sleep_until (t=<optimized out>)
        at /home/jack/Projects/rpi-pico/pico-sdk/src/common/pico_time/time.c:408
    #3  0x100013c8 in sleep_us (us=250000)
        at /home/jack/Projects/rpi-pico/pico-sdk/src/common/pico_time/time.c:424
    #4  sleep_ms (ms=ms@entry=250)
        at /home/jack/Projects/rpi-pico/pico-sdk/src/common/pico_time/time.c:440
    #5  0x10000346 in main ()
        at /home/jack/Projects/rpi-pico/pico-examples/blink/blink.c:51
    (gdb) frame 5
    #5  0x10000346 in main ()
        at /home/jack/Projects/rpi-pico/pico-examples/blink/blink.c:51
    51	        sleep_ms(LED_DELAY_MS);
    (gdb) list
    46	    hard_assert(rc == PICO_OK);
    47	    while (true) {
    48	        pico_set_led(true);
    49	        sleep_ms(LED_DELAY_MS);
    50	        pico_set_led(false);
    51	        sleep_ms(LED_DELAY_MS);
    52	    }
    53	}
    (gdb) break 49
    Breakpoint 1 at 0x10000332: file /home/jack/Projects/rpi-pico/pico-examples/blink/blink.c, line 49.
    (gdb) break 51
    Breakpoint 2 at 0x10000340: file /home/jack/Projects/rpi-pico/pico-examples/blink/blink.c, line 51.
    (gdb) continue
(At this point, pressing Enter would cause the LED to toggle on and off.)
The topic of actually using GDB is out of scope for this page, but it is well worth learning. A few commands such as "step", "next", "print", "break" and "continue" are all you really need to know (along with "quit"). The more advanced features can be learned if necessary - much like vim, a typical user only uses a tiny percentage of the available features (I am in this category for both vim and GDB). A need to use GDB has come up repeatedly throughout my working life, as it has often been the only debugger that's actually usable, or the only one that can be installed. There are frontends for GDB, for example VS Code plugins, but the ones I have tried are quite difficult to configure in comparison to GDB's command line, and can be quite unreliable too. A debugging GUI can be very good (e.g. Lauterbach, or the original Visual Studio, or IntelliJ) but for some reason GDB frontends have never seemed to be worth the effort to learn. My advice, learn GDB's own commands and use it directly!