A detailed timing trace, with video demonstration
Tuesday, 29 March 2016
My last article discussed the differences between tracing and profiling. Compared to tracing, profiling is much easier to set up, but it only reveals information about the average execution of your program. It won't tell you anything about rare events - the "long tail" - which could cause high latency in certain cases.
I found this very interesting article by Dan Luu in which he discusses performance problems which cannot be analysed using a sampling profiler - because the rate of sampling is just not fast enough. The article is all about online services, but the problem described here is actually the "worst-case response time" problem. To me, this is an embedded systems problem. It applies to real-time systems where safety requires the software to respond within a known time interval - like the computer controlling a jet engine, for instance. It is known to be a very hard problem, and the solutions described in the article (tracing) are exactly the same solutions applied at the company where I work! But we're doing it for embedded systems. It's very interesting to read that the exact same problems exist in online services, and at sufficient scale, they can be extremely costly.
I thought it might be interesting to share an example of tracing in action. The following video is taken from Doom. The game source code has been instrumented so that function calls and returns are timestamped. The video shows the game rendering certain scenes in real time, as if the CPU speed were slowed from 800MHz to just 48kHz. At this low speed, you can see what the game is doing as it draws each scene.
This video is possible because a trace was used to capture detailed timing information. I couldn't actually reduce the CPU speed to 48kHz, so I ran the game twice. The first pass created the timing trace. The second pass created the video. A video frame is captured every 1600 clock cycles
A profiler would just show that certain rendering functions are called very frequently - this is helpful for reducing the average time required to draw a scene, but not for reducing the longest possible times required for certain scenes. A trace has enough detail to reconstruct everything. We can see almost exactly what the game is doing with each CPU clock cycle. If anything takes longer than expected, even only once, there are analysis tools to help you understand why.
You can see that the "long tail" has been captured by the tracing software in the following graph. It shows the total time needed to render each of the frames produced by the game while playing a demo:
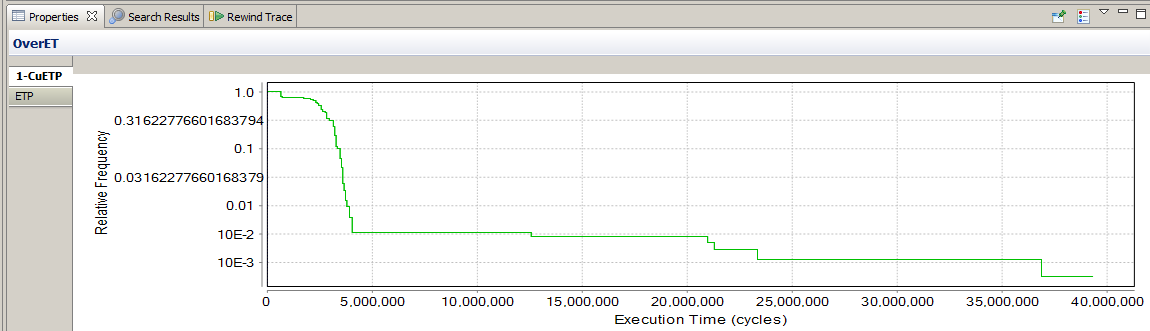
Almost all game frames take less than 4 million clock cycles to draw, and the average is 2.3 million. But there are some which take much longer - 39 million in one case! Fortunately, the explanation is straightforward. These frames represent transitions between levels, and the extra time is the time required to load the new level from disk. The game is not playable while the next level is loading, so the extra latency doesn't matter to the player.
Though it's more difficult to capture a detailed timing trace than to capture a profile, you get much more information with a trace, and that extra information can reveal things about the program that profiling cannot show, such as the long tail of latency. This information may be used to estimate and reduce the worst-case response time of the code.