Looking at the Linux kernel with "reverse maps"
Sunday, 31 January 2016
I was asked to add some functionality to the Linux kernel to help capture timing information. The target platform is an embedded systems development board with a PowerPC CPU. This runs a (basically) vanilla version of Linux version 3.12 for PowerPC. In "user space" the distribution is Debian version 8.
The problem facing me here was my limited familiarity with the kernel. Like most people with CS degrees, I have a basic understanding of what it does, but I don't know the implementation details - especially not for PowerPC. There was much to learn. In the "arch/powerpc" directory, I was faced with 37000 lines of assembly code and nearly 152000 lines of C. A daunting prospect, and that is just the architecture-specific part of the kernel! How could I make sense of it quickly?
The aim was to add a feature which would log all transitions between user space (an application) and the kernel with timestamps.
Faced with the complexity of the code, I began by a sort of informed guesswork. I thought of events that would cause kernel -- user transitions: system calls, task scheduling and external interrupts triggered by hardware devices. I added tracing code for those cases, using the elegant "tracepoint" mechanism that is already in the kernel. I got this working. The log was captured by a kernel module and could be "downloaded" through a device in /dev.
Then I found that there were plenty of other ways to enter the kernel. These didn't show up in my log. Instead they showed up in timing measurements as long unexplained latencies. On this platform, the causes included floating-point emulation, page faults, alignment exceptions, illegal instruction exceptions and timer interrupts. All of these events needed to be detected. I could not miss anything out: the application measurements had to be accurate.
I realised I did not know how to detect these events. There was a lot of code in "arch/powerpc" which appeared to be related to them, but there is also a lot of replication to support different siblings in the PowerPC family: the code for 40x isn't all the same as 440, and different again from 603e. E200 and E500 have their own code too. Though all these CPUs share the same basic instruction set, there are crucial low-level differences in the hardware which require different drivers. These differences are rare in the x86 world where compatibility is crucial, being limited to workarounds for buggy chipsets, but they're completely normal in the embedded systems world.
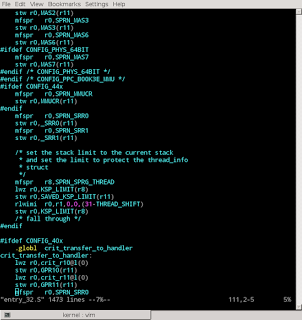
"arch/powerpc/kernel" is filled with preprocessor macros (#ifdef, etc.) to enable different code paths depending on the exact variant of PowerPC as specified in the kernel configuration: CONFIG_40x, CONFIG_44x, etc. This is extremely complex. It is very hard to see which code will actually be used (live code), and which is omitted for a particular platform (dead code). Just looking at the C and assembly code was not enough for me to understand how the kernel was actually handling interrupts. I saw many different interrupt handlers for different PowerPC variants. I could not unpick which ones were in use.
The solution was to look at the code through a "reverse map".
In low-level programming, a "map" is a file showing the relationship from machine code addresses to symbols. Sometimes a map also reveals the relationship to source code lines. You can obtain a map for a Linux program by running the "nm" tool. You can go even further with the "addr2line" tool, translating addresses to source code lines, if the program includes debugging information. But the "objdump" tool beats both of them for many purposes, because it provides addresses, symbols, source code and disassembled machine code all in the same place! Here's an example:
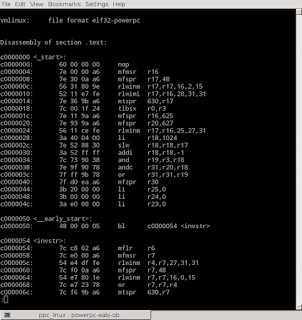
A "reverse map" is the opposite of a map: it goes from source code line to code address.
create_reverse_map.py scans the output of "objdump" when applied to the "vmlinux" (containing the kernel) It reads code addresses and source code lines. For each source file, it creates a map from line numbers to addresses. This reverse mapping is saved in a data file alongside the source.
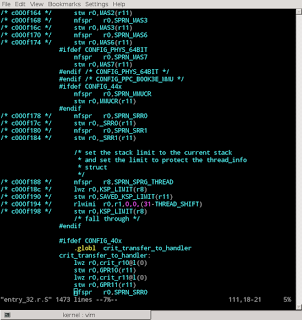
view_reverse_map.py combines a source file with the reverse map data, annotating the source code to show corresponding addresses:
This reverse map technique can unravel the complexity introduced by a preprocessor or compiler. It is language-independent, requiring only that debugging symbols are present. It could be applied to any program, not just a kernel, though it is probably most appropriate to programs which make heavy use of preprocessing and have many compile-time configuration options to control the preprocessor. Simpler programs are amenable to simpler techniques such as an identifier search within an IDE.
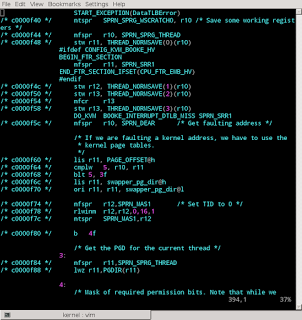
By using it, I was able to exclude many source files, knowing that they were not used in my kernel's build configuration. Within the remaining files, I could ignore large sections of code, again knowing that they are unused. This simplified the work enormously. I did not have to determine which of the many different MMU drivers actually mattered - the answer was already revealed. And I could immediately see where the interrupt vectors were:
I could also have approached the problem using a debugger, but I'd need a debugger capable of stepping through the kernel's setup code. This would require debugging hardware: an "in circuit emulator" capable of controlling the CPU directly. These are very valuable for low-level kernel development, but they're extremely platform-specific and very expensive, and I don't have one for this particular board. So I needed to find another way. If I were working with x86 code, I could use a system-level simulator such as QEMU in place of debugging hardware, but that won't work in this case because QEMU's PowerPC simulator is too generic, i.e. it doesn't simulate this specific sort of PowerPC platform. A reverse map, from "vmlinux" to source code, was the easiest way approach.